Legal AI incidents, by the numbers
As of 2026-10-07, the dataset holds 173 incidents across 15 jurisdictions, from 2023-06-22 to 2026-10-07. 51 carry a recorded regulatory or disciplinary disposition, 51 carried a monetary penalty, and the AI tool is identified in 69 records. These are verified records, not a worldwide census.
- incidents on the record
- jurisdictions
- regulatory outcomes
- sanctions/fines total
- records naming a tool
Recent pace: 89 decisions or orders in the last 90 days, against 11 in the 90 days before.
Monetary penalties: 51 records · US$380,383.25 USD · £24,727.20 GBP · CA$36,100 CAD · A$17,469.23 AUD · SGD 10,000 SGD · ₪36,000 ILS · €1,250 EUR.
Incidents by jurisdiction, outcome, actor and year
Incident counts and severity distribution
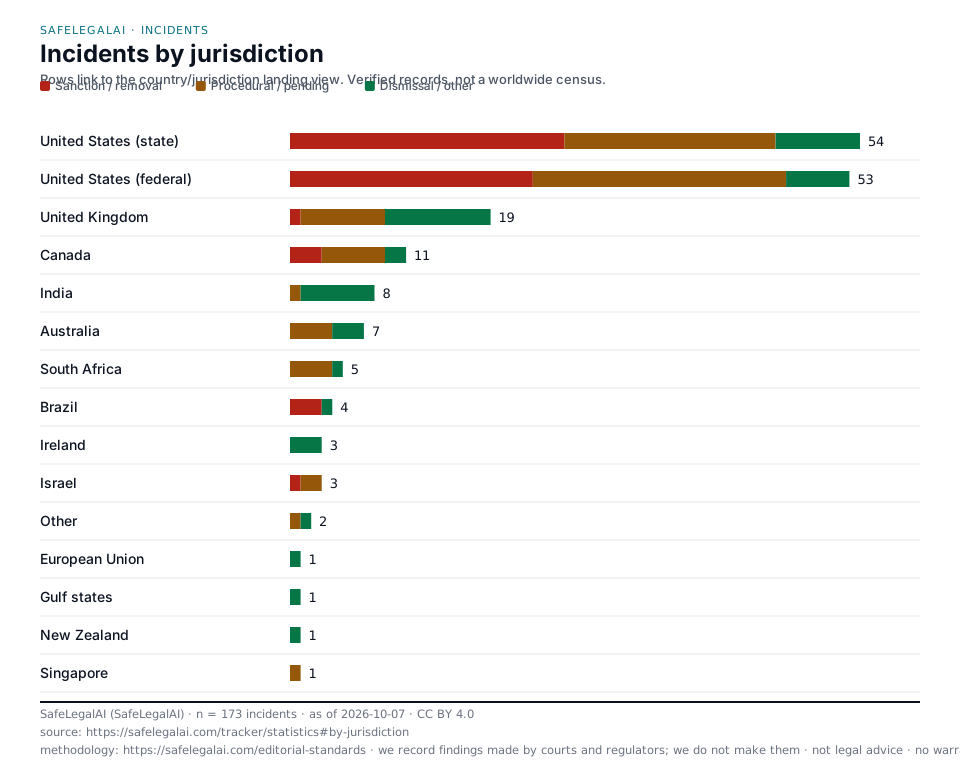
Sanction / removalProcedural / pendingDismissal / other
Incidents by jurisdiction
Rows link to the country/jurisdiction landing view.
| United States (state) | 54 | |
|---|---|---|
| United States (federal) | 53 | |
| United Kingdom | 19 | |
| Canada | 11 | |
| India | 8 | |
| Australia | 7 | |
| South Africa | 5 | |
| Brazil | 4 | |
| Ireland | 3 | |
| Israel | 3 | |
| Other | 2 | |
| European Union | 1 | |
| Gulf states | 1 | |
| New Zealand | 1 | |
| Singapore | 1 |










Incidents by outcome
Outcome colour follows the incident severity semantics.
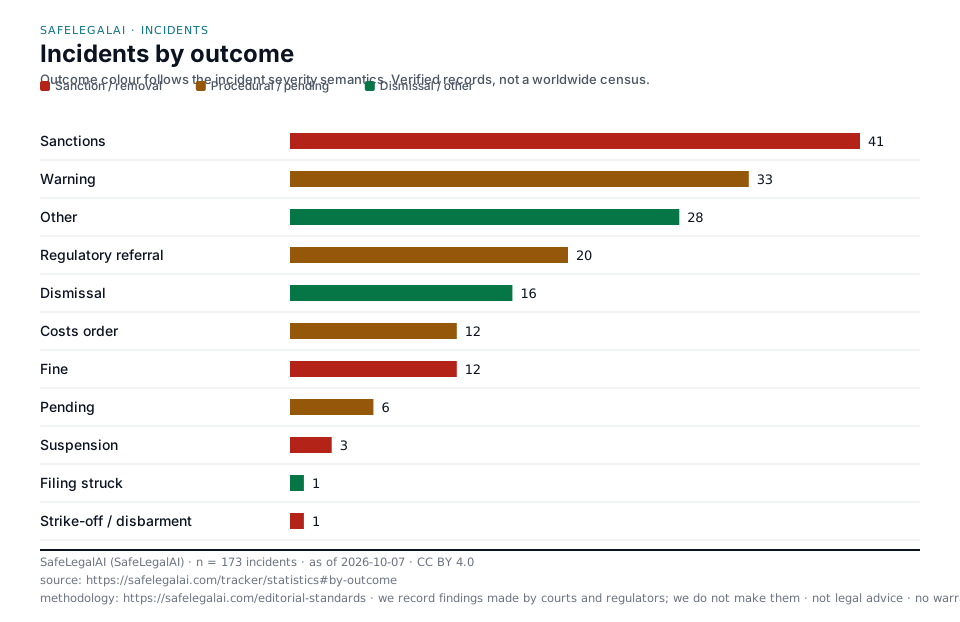
| Sanctions | 41 | |
|---|---|---|
| Warning | 33 | |
| Other | 28 | |
| Regulatory referral | 20 | |
| Dismissal | 16 | |
| Costs order | 12 | |
| Fine | 12 | |
| Pending | 6 | |
| Suspension | 3 | |
| Filing struck | 1 | |
| Strike-off / disbarment | 1 |
Incidents by actor
Who the public record identifies as having misused or relied on the AI output.
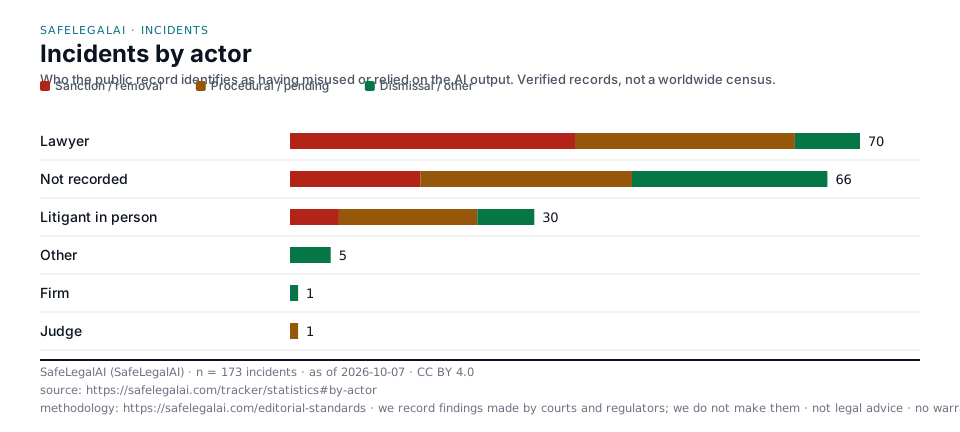
| Lawyer | 70 | |
|---|---|---|
| Not recorded | 66 | |
| Litigant in person | 30 | |
| Other | 5 | |
| Firm | 1 | |
| Judge | 1 |
Incidents by year
Decision or order year; this is not a filing-year census.
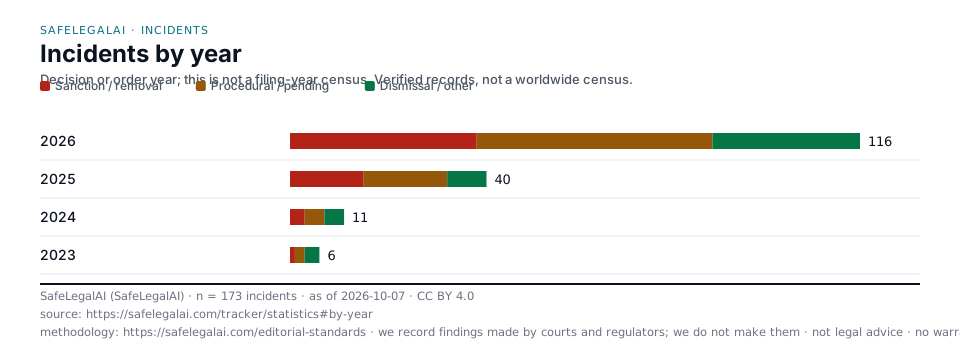
| 2026 | 116 | |
|---|---|---|
| 2025 | 40 | |
| 2024 | 11 | |
| 2023 | 6 |
Cite these figures
SafeLegalAI (SafeLegalAI), "Legal AI incidents, by the numbers — 173 incidents, 15 jurisdictions, 51 regulatory outcomes", as of 2026-10-07, https://safelegalai.com/tracker/statistics#headline. Data: CC BY 4.0. Methodology: safelegalai.com/editorial-standards.
Every chart above downloads as SVG or PNG with the title, "as of" date, source URL, methodology and licence inside the image, and is regenerated whenever the data changes: by-jurisdiction.svg · by-outcome.svg · by-actor.svg · by-year.svg. Reuse the data another way: embed a widget, syndicate the weekly block, watch one jurisdiction.